Game development is hard work. Just like any form of software development there are going to be bugs in the code. Debugging games can be especially challenging due to their fast paced real time nature. Fortunately, Phaser comes with quite a few tools built in to help you debug your games. Other than reading the API documentation or looking at the source code of examples, there isn’t a whole lot of extra detail on how to debug them out there. In this guide, I’ll explain what’s available, and some real world ways to use them to combat the onslaught of code bugs.
Table of contents
About the Source Code Examples
All of the source code examples used in this tutorial are available in this zip file. Throughout the tutorial I’ll be using ES2015 (ES6) JavaScript features. As of this writing, not all of these features are readily available in all of the browsers yet. The project that I have created uses jspm and Babel to enable the usage of these features now. If you’re not familiar with ES2015, I recommend Exploring ES6 , an eBook that is a fantastic reference on the subject.
Learn Phaser by building 15 games
If you want to master Phaser and learn how to publish Phaser games as native games for iOS and Android feel free to check Zenva‘s online course The Complete Mobile Game Development Course – Build 15 Games.
The Debug Object
Phaser comes built in with an instance of a Debug class attached to each game. It is always there though if you don’t use it (making it become flagged as “dirty”) it won’t affect your performance. The debug object works by drawing various information, shapes, etc to a canvas. In the case of a canvas based renderer, it uses the same context as the game’s canvas. In the case of WebGl, it needs to create a new canvas and render everything from that canvas to a sprite object to overlay over the game screen. In both cases (though especially true for WebGl) the debugging features should be used ONLY for debugging, and disabled when you ship the real version of the game.
When developing javascript applications in the browser, you might be used to using the developer console output for debug information. The problem with using that for games is that the information that we most often care about gets updated every frame instead of based on events. If we were to output the position of sprite for example, it would continuously scroll the console and we wouldn’t be able to keep track of things very easily. This is why the ability to render debug information to our game screen is so important.
Text
Probably the simplest tool for debugging is drawing arbitrary text to the screen. The first parameter is the text that you want to display. Next you need to pass in the x & y coordinates that you want the text to start from. You can also pass a color and font information in if you wish.
render() {
    this.game.debug.text(`Debugging Phaser ${Phaser.VERSION}`, 20, 20, 'yellow', 'Segoe UI');
}
Another way to draw text to the screen is using the line method. This one is actually used “internally” by many of the other Phaser debug methods. The debug object keeps track of the current position of a text cursor. Each time that line is called it uses the position of that cursor (x & y coords on the screen) and modifies the y for the next “line” of text. There are two more companion methods for this, start and stop. Calling start with x & y parameters passed in will set the cursor for the subsequent debug lines. It will also save the canvas state so that any other operations are not affected, so it’s important to call stop again when you are done. You can call the line method without having called the start method first, however it’s not recommended as the cursor’s position will be unknown.
this.game.debug.start(20, 20, 'blue');
this.game.debug.line();
this.game.debug.line('First line.');
this.game.debug.line('Second line.');
this.game.debug.stop();
Camera
You could use the text and line methods to display information about the properties of a camera onto the screen, but instead another built in method is cameraInfo. This method automatically displays information about the camera’s position, bounds, and number of visible sprites (based on the autoCull property). You need to pass in a reference to the camera you want info on, and the starting coordinates for the information. It will render 4 lines from that point to display all of the stats.

this.game.debug.cameraInfo(this.game.camera, 32, 32);
Input
Of course games are interactive, so how the controls behave is very important. Phaser has several ways to display information about various inputs for debugging purposes.
You can display information about a particular key being pressed on the keyboard using the key method. It takes a reference to a Phaser.Key object as well as the coordinates to display the information.
// inside create method
this.testKey = game.input.keyboard.addKey(Phaser.KeyCode.SPACEBAR);

// inside render method
this.game.debug.key(this.testKey, 32, 128);
This will output a table of information about the key including the key code, whether or not it isDown, if it was justDown or justUp as well as a duration that it has been held down (if held down).

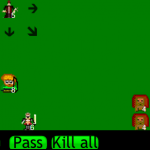
Generally we’re also going to take input from a mouse or some other pointer like touch. For that, Phaser also has another method aptly named pointer . This one takes a reference to the pointer that you want to inspect and that’s it. The information actually follows the pointer around in this case.
this.game.debug.pointer(this.game.input.activePointer);

In this case the white line starts from the last place the pointer was “clicked” and extends to the current position (useful for dragging or swiping). The green circle represents the pointer itself and follows it around. When you hold the button down, the duration counter ticks up. (The little bug image there is just a sprite, not part of the debug info.)
Perhaps you don’t need all of that info following around the mouse, but you just need to know where it is, well then you’re in luck, another simpler method is the inputInfo method which does just that. All that you need for this one is to tell it where to render.
this.game.debug.inputInfo(32, 32);

Sprites
Sprites are one of the most important objects to any Phaser game, so not surprisingly, there are 4 debug methods specifically designed for them.
The first is spriteInfo which displays info about a sprite and its relation to the world. Important stuff like it’s position, angle, anchor, bounds, and whether or not it’s in view of the camera. ![]()
this.game.debug.spriteInfo(sprite, 32, 32);
Next spriteCoords is all about position, where the sprite is on the screen, and where the sprite is in the world. Quite a bit less detailed than spriteInfo, but sometimes all that you really need to know is where your sprite is. ![]()
this.game.debug.spriteCoords(sprite, 32, 128);
You can get information about how a sprite is being interacted with by various input devices using spriteInputInfo. It displays a block of information at some coordinates just like spriteInfo, however this is all about input. In order for this one to work, the sprite actually needs to have input functions enabled, if they aren’t by the time that you call this method, you’ll get an error. Remember, for performance reasons, sprites do not have input enabled by default, you have to explicitly turn them on first.
![]()
this.game.debug.spriteInputInfo(sprite, 32, 192);
![]() The last one is spriteBounds which will render a rectangle around the bounding box of the sprite, which might be the image, or the size of the sprite within a spritesheet if it is a part of one.
The last one is spriteBounds which will render a rectangle around the bounding box of the sprite, which might be the image, or the size of the sprite within a spritesheet if it is a part of one.
this.game.debug.spriteBounds(sprite);
Sounds
A small but handy block for displaying sound information is available using soundInfo. This one will show you whether the sound has been loaded and ready to use by the browser, whether or not it’s using WebAudio as well as how long the sound has been playing and at what volume.
this.game.debug.soundInfo(this.splat, 32, 32, 'yellow');

Geometry
Geometry in Phaser is generally only used for logic purposes. It can be difficult however to wrap your brain around what’s happening without a visual component. This is where the debug geom method comes into play. Geom can render a Circle, Rectangle, Point, or Line. Additionally, there is another method: rectangle, which as it suggests just renders a rectangle. In either case you can pass in an instance of one of Phaser’s proper geometry classes, or an object that has the necessary properties to render the shape. For geom, if it’s just an object, you need to pass in a fourth parameter to let it know what kind of shape it really is.
class GameState extends Phaser.State {
    preload() {
        this.game.load.image('bug', 'assets/bug.png');
    }

    create() {
        let bugs = this.bugs = this.game.add.group();
        bugs.createMultiple(30, 'bug', '', true);
        bugs.setAll('anchor.x', 0.5);
        bugs.setAll('anchor.y', 0.5);
        bugs.setAll('inputEnabled', true);
        bugs.forEach(bug => {
            bug.position.set(this.game.rnd.integerInRange(0, this.game.width), this.game.rnd.integerInRange(0, this.game.height));
            bug.detectRadius = 24;
        });
        bugs.callAll('events.onInputDown.add', 'events.onInputDown', this.onBugClick, this);

        this.currentBug = null;
    }

    onBugClick(bug) {
        this.currentBug = bug;
    }

    render() {
        if (this.currentBug) {
            this.game.debug.geom(new Phaser.Circle(this.currentBug.x, this.currentBug.y, this.currentBug.detectRadius * 2));
        }
    }
}
In addition to the geom method there is also a pixel method that will allow you do render as the name would suggest, a single pixel to the screen. Unlike rendering a point using geom, it does not have to be a Phaser Point object, instead just any arbitrary coordinates on the screen. You pass in x & y, the color to render your pixel, as well as the size. The default size is 2, and you might be saying well that’s not a single pixel, true, but those can be hard to see (so tiny) so it makes sense to use 2 or perhaps even 4.
this.game.debug.pixel(100, 100, 'red', 4);
Physics
Phaser ships with three different physics options: Arcade, Ninja, and P2. Because they have a unified API you can actually use them all at the same time if you desire. Each physics enabled object will have a body attribute that will contain a reference to the physics body that forces are applied to in each system. Because all of them will have a body property with similar attributes on it we can pass that body reference into debug.bodyInfo . That method will render information about position, velocity, acceleration, gravity, etc to the screen for the body passed in.
We can also highlight the physics body on the screen using the debug.body method. Since the physics body is a logical shape used for collision, this can be important to visualize as it might not always match up with the sprite that it is attached to.
class GameState extends Phaser.State {
    init() {
        this.game.physics.startSystem(Phaser.Physics.ARCADE);
        this.game.physics.arcade.gravity.y = 1000;
        this.game.physics.arcade.skipQuadTree = false;
    }

    preload() {
        this.game.load.image('bug', 'assets/bug.png');
    }

    create() {
        let bugs = this.bugs = this.game.add.group();
        bugs.enableBody = true;
        bugs.createMultiple(30, 'bug', '', true);
        bugs.setAll('anchor.x', 0.5);
        bugs.setAll('anchor.y', 0.5);
        bugs.setAll('inputEnabled', true);
        bugs.forEach(bug => {
            bug.position.set(this.game.rnd.integerInRange(0, this.game.width), this.game.rnd.integerInRange(0, this.game.height));
            bug.detectRadius = 24;
        });
        bugs.callAll('events.onInputDown.add', 'events.onInputDown', this.onBugClick, this);

        bugs.forEach(bug => {
            //this.game.physics.arcade.enable(bug);
            bug.body.collideWorldBounds = true;
            bug.body.bounce.set(0.8);
            bug.body.velocity.x = Math.random() * 500 * (Math.random() > 0.5 ? -1 : 1);
        });
        bugs.setAll('body.drag.x', 10);

        this.currentBug = bugs.getRandom();
    }

    update() {
        this.game.physics.arcade.collide(this.bugs, this.bugs);
    }

    onBugClick(bug) {
        this.currentBug = bug;
        bug.body.velocity.y += -1000;
        bug.body.velocity.x += Math.random() * 1000 * (Math.random() > 0.5 ? -1 : 1);
    }

    render() {
        this.game.debug.quadTree(this.game.physics.arcade.quadTree);
        if (this.currentBug) {
            this.game.debug.body(this.currentBug);
            this.game.debug.bodyInfo(this.currentBug, 32, 32);
        }
    }
}
Another thing that we can render is a QuadTree. If you’re not aware, a quadtree is a spatial partitioning algorithm that can help reduce the number of bodies that you need to test for collisions (or other spatially relevant information). In Phaser, it only exists as a part of the Arcade physics system, and is disabled by default. We can enable it by setting game.physics.arcade.skipQuadTree = false; and then each physics body will automatically be added to the quadtree. Phaser’s QuadTree class however can be used outside of the physics system for any purpose you’d like, and the debug quadtree renderer will render any quadtree derived from that class.

Phaser also supports the Box2D physics system via a premium plugin available from the website. If you have this plugin, there are 2 built in functions in the Debug object for displaying information about Box2D bodies. The methods are box2dBody and box2dWorld. Both of them use the default Box2D debug canvas renderer, all Phaser is doing is simply providing access to the debug canvas context to Box2D. If you decide to purchase this plugin it comes with much more information and documentation.
Debugging in our own projects
The methods built into the Debug object cover some of the most common, and also most basic scenarios when it comes to getting debug information about your game. When we’re building our own projects, there is likely going to be more information that you need to be able to see than Phaser can anticipate. This is where the basic blocks such as text and geom really come into play.
We should then dive into the source code of Phaser (it’s not scary, it’s just javascript!) and take a look at the implementation details for other methods such as spriteInfo.
spriteInfo: function (sprite, x, y, color) {

        this.start(x, y, color);

        this.line('Sprite: ' + ' (' + sprite.width + ' x ' + sprite.height + ') anchor: ' + sprite.anchor.x + ' x ' + sprite.anchor.y);
        this.line('x: ' + sprite.x.toFixed(1) + ' y: ' + sprite.y.toFixed(1));
        this.line('angle: ' + sprite.angle.toFixed(1) + ' rotation: ' + sprite.rotation.toFixed(1));
        this.line('visible: ' + sprite.visible + ' in camera: ' + sprite.inCamera);
        this.line('bounds x: ' + sprite._bounds.x.toFixed(1) + ' y: ' + sprite._bounds.y.toFixed(1) + ' w: ' + sprite._bounds.width.toFixed(1) + ' h: ' + sprite._bounds.height.toFixed(1));

        this.stop();

    }
We can see that they use the sprite reference that we pass in, as well as the x & y coordinates in combination with the start method that I mentioned at the beginning. Then using the line method, render lines of details about the sprite to the screen.
Let’s say that we don’t just want to display sprite information generically, but we have created a sprite object and attached several other properties to it, to make it represent the player in the game. The spriteInfo method doesn’t give us any details about these extra properties (it doesn’t even know what they are!), nor does it give us any information about other things that already exist on a sprite such as the health and max health. In this example our plane is tracking a lot of different things, and we will want to be able to report about some of them.
        let bullets = game.add.group();
        bullets.enableBody = true;
        bullets.physicsBodyType = Phaser.Physics.ARCADE;
        bullets.createMultiple(100, 'bullet');
        bullets.setAll('anchor.x', 0.5);
        bullets.setAll('anchor.y', 0.5);
        bullets.setAll('outOfBoundsKill', true);
        bullets.setAll('checkWorldBounds', true);

        let plane = this.plane = this.game.add.sprite(200, 200, 'plane');
        plane.heal(Infinity);
        plane.anchor.setTo(0.5);
        plane.scale.setTo(0.5,0.5);
        this.game.physics.enable(plane, Phaser.Physics.ARCADE);
        // animation
        plane.animations.add('fly');
        plane.animations.play('fly', 30, true);
        plane.sounds = {
            engine: this.game.add.audio('plane_engine'),
            gun: this.game.add.audio('plane_gun'),
            die: this.game.add.audio('boom')
        };
        plane.sounds.engine.loopFull(0.35);

        plane.bullets = bullets;

        plane.fireTimer = this.game.time.now;

        plane.events.onKilled.add(this.planeKilled, this);

        plane.score = {
            killsByCollision: 0,
            killsByShooting: 0
        };
In order to display some useful information, we’ll need to create a custom debugging method. Notice that we can display bits and pieces that we might find in other debug methods, as well as our custom properties.
    displayDebugInfo() {
        this.game.debug.start(32, 32);
        this.game.debug.line(`Health: ${this.plane.health}/${this.plane.maxHealth}`);
        this.game.debug.line(`FireTimer: ${this.plane.fireTimer}`);
        this.game.debug.line(`Gun Sound: ${this.plane.sounds.gun.currentTime} Playing: ${this.plane.sounds.gun.isPlaying}`);
        this.game.debug.line(`Plane Loc: (${this.plane.x}, ${this.plane.y})`);
        var body = this.plane.body;
        this.game.debug.line(`plane body: [${body.x.toFixed(2)}, ${body.y.toFixed(2)}] width: ${body.width} height: ${body.height}`);
        this.game.debug.line(`kills: ran into ${this.plane.score.killsByCollision} and shot ${this.plane.score.killsByShooting}`);
        this.game.debug.stop();

        this.game.debug.body(this.plane);

        this.game.debug.text('anchor', this.plane.x + 4, this.plane.y, 'red');
        this.game.debug.pixel(this.plane.x, this.plane.y, 'red', 4);
    }

One thing that I immediately find useful is the rendering of the anchor and physics body. First we can see that the anchor for the sprite is not actually centered on the plane itself. Also the physics body is not centered on the plane, as well as it is taking up a lot more space than the actual plane image as well. This means that we are going to collide with enemies at such a distance that isn’t going to feel right to players. From the plane body text information, we can see that the width and height are both 128. The actual size of the plane (each frame) is 176. Since I’m also scaling the plane down by half, it would seem that Phaser has originally bumped my image up to 256. Now I know where to look to solve the problem, something to do with the image size.
I used Texture Packer to generate the 3 frame sprite for the plane from 3 separate images. (If you haven’t heard of Texture Packer, I highly recommend that you check it out, it’s a really handy tool for dealing with lots of sprites in an organized and efficient way.) I loaded the JSON atlas file that it generated into Phaser, and this is the result I got. The original 3 images were each sized 256 x 256 so that is where the size came from (Phaser didn’t do anything to them). It seems to be reading the source image size from the JSON file. As a quick test, I switched from loading the JSON atlas file to just loading a spritesheet and supplying the dimensions for each frame. That solved the problem, at least in the case that I only have 1 plane animation on the sheet, and all of the frames are the same size (which is true in this case). I looked online and found this forum post in which another user was having similar trouble. I found that using Texture Packer’s “trim” feature was the issue, Phaser will use the source size in this case because the sprites are being packed for the purposes of image memory consumption, but still need to be rendered as if they were separate images. In my case however, I want to use “crop” mode as I don’t want this behavior, I want to use it in packed form. Changing the output to cropped did the trick! Now the collision body and the anchor line up, and everything is working the way that I wanted.

Hopefully you can see now how knowing how to display information about your game can help with debugging. The process that I just went through I did not simulate, I actually created the demo for this and found the issue with the sprites after I turned on the debugging tools. (Worked out great for me to have a real issue while writing the tutorial!)
I mentioned earlier that having this debug information showing is expensive, and of course you don’t want it to display in the final version of your game. You can go back and comment out or delete the code that displays the debug info, but that can get tedious after a while. Instead you can create a simple flag in the code that determines whether or not it should show.
    init() {
        this.game.stage.disableVisibilityChange = true;

        this.debugMode = false;
    }
First I add the test to the init phase of my state. Then I can simply wrap the displayDebugInfo method in a conditional in the render method.
    render() {
        if (this.debugMode) {
            this.displayDebugInfo();
        }
    }
You can manually toggle that flag that is in the init method, or you can also setup a key to toggle it at runtime. Something like this should do the trick:
    toggleDebug() {
        this.debugMode = !this.debugMode;
        if (!this.debugMode) {
            this.game.debug.reset();
        }
    }
// inside create
this.debugKey = this.game.input.keyboard.addKey(Phaser.Keyboard.D);
this.debugKey.onDown.add(this.toggleDebug, this);
Now you should be able to turn on and off debug mode using the D key on the keyboard (feel free to change it to whatever you like). One final method to mention about the Debug object in Phaser is the reset method. This will clear the canvas or sprite image so that even when debug mode is “off” it won’t render the last thing that it rendered. Remember, debug is always there, you just can’t see it until you start drawing to the surface.
Go forth and Squash!
Thanks for taking the time to read this guide about Phaser Debugging. As game developers (and software developers) we always have bugs to deal with, hopefully this guide will help you squash them quickly. Please leave any comments or questions below, or let me know how you have used the debug tools to save the day!