Table of contents
Part 2 Recap
This tutorial is part of a multi-part series. In Part 1, we loaded our data from a .csv file and used Linear Regression in order to predict the number of patients that the hospital is expected to receive in future years. In Part 2 we improved the UI and created a bar chart.
Introduction
Welcome to the third and last part of this tutorial series. In this part, we will use Easy AR in order to spawn our patient numbers histogram on our Image Target in Augmented Reality.
Tutorial Source Code
All of the Part 3 source code can be downloaded here.
Did you come across any errors in this tutorial? Please let us know by completing this form and we’ll look into it!
FINAL DAYS: Unlock coding courses in Unity, Godot, Unreal, Python and more.
Easy AR
Easy AR SDK is an Augmented Reality Engine that can be used in Unity, basically allows us to set an image as a target. Easy AR will detect this image target from a live camera of a device like a smartphone or a tablet, when the image will be detected the magic will happen and our object will spawn.
First, we need to create a free account on the website of Easy AR, simply using a password and email, this is the link to the website.
After we sign in into the Easy AR website and create an SDK license key, in the SDK Authorization section click on “Add SDK License Key”. Choose the “EasyAR SDK Basic: Free and no watermark” option. It is required to fill Application Details, don’t worry too much about this because you change those values later.
In the SDK Authorization now we can see our project, let’s copy our SDK License Key because we will need it later.
Let’s download the Easy AR SDK basic for Unity from this page
Now let’s open our project in Unity, after the project is loaded we need to open the downloaded Easy AR package just by click on it![]()
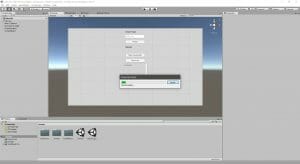
Unity should notice the decompression of the package like in the screenshot
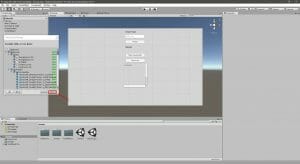
After the decompression Unity will ask to import the files, just click on import and wait a little bit
Now open the scene with the graph, in my case is tutorial_graph
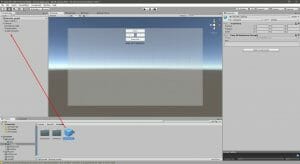
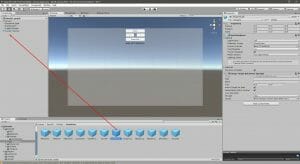
Let’s add the EasyAR_Startup prefab to the scene, just dragging it from the Unity File browser to the Hierarchy section, like in the screenshot below. You can find this prefab in the Assets/EasyAR/Prefabs folder.
Select EasyAR_Startup from the Hierarchy section, in the inspector you should see a “key” textbox, paste your Easy AR key here. We obtained that key before, when creating our project in the Easy AR website.
Let’s remove our maincamera, because we don’t need it anymore, now the main camera will be our device camera
Now if you hit the play button you should see from the webcam of your computer
The image target
We need to create the folder structure for your image target and materials, first inside Easy AR folder create a “Materials” folder
Always inside Easy AR folder create a “Textures” folder
Create a “StreamingAssets” folder inside the Assets folder
Choose an image target, I suggest you to choose an image with a square size, the best thing is a QR code, feel free to use the logo of your company or something similar, remember that the image should have evident edges and contrasts otherwise will be really hard for the camera to detect it. For example, a light grey text on a white background will be almost impossible to recognize etc….
I used this image of a patient and a medic to stay in theme with our project
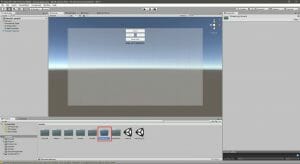
Copy your target image inside Assets/Streaming Assets and Assets/Easy AR/Textures
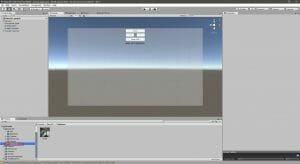
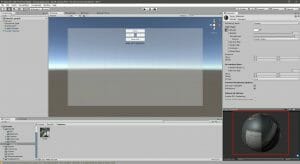
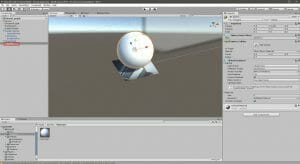
Now create a new material inside EasyAR/Materials called Logo_Material
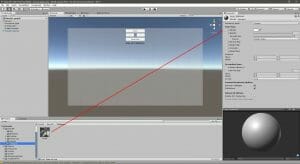
Drag the logo image inside the Albedo input of the material
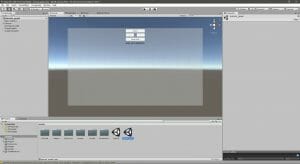
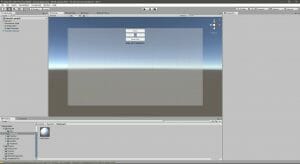
This should be the material result, now the material sphere instead of being just gray will display your texture image
Now we need to drag the ImageTarget prefab from the EasyAR/Primitives folder inside the Hierarchy section, this will enable us to use the Image Target.
Select the ImageTarget object and in the Inspector complete the ImageTarget input fields with the path with the name of your image, in my case “target.jpeg” and the name “imagetarget”
We need to specify a size for our image target, I will use 5 for both x and y, feel free to use any size
This is really important, we need to change the image target Storage to Assets
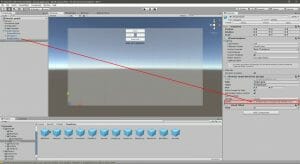
Now let’s drag the ImageTracker from the EasyAR_startup inside the Loader input of the image target. This will tell Easy AR which image tracker use in order to detect the image by the device camera feed.
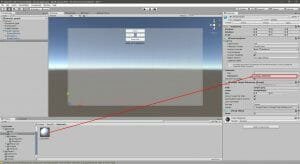
Inside the Material section of image target, we drag our Logo_Material on the Element 0 input
Now if everything is done correctly, the image target should display the image we choose before
Let’s test our work, create a cube inside the ImageTarget object, we will use it later as an object reference for our patients’ number graph. This cube will help us later to anchor the graph on the image target, let’s call it “graph_anchor”
Hit play and the cube should appear over the image target if the device camera detects the image. Don’t worry if you have to wait like one minute in order to let Unity switch on your device camera, it’s a slow process when you are developing a project, but it will be faster when the project will be transformed into an app.
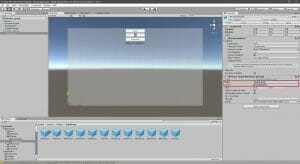
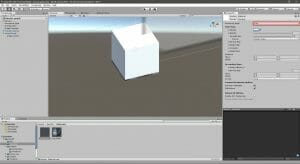
Now we need to make that cube invisible so only our future histogram will be visible on the image target. Let’s create a new material called “Anchor_Material ” inside the Assets/EasyAR/Materials Folder. In order to make it fully transparent (invisible) we need to set the Rendering Mode to Fade
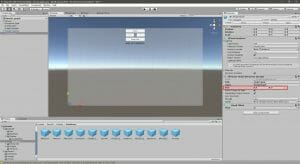
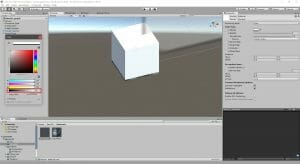
The alpha of the Albedo section must be set to 0, as you can see in the screenshot below
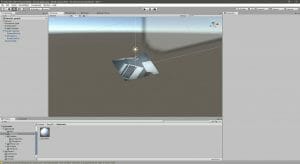
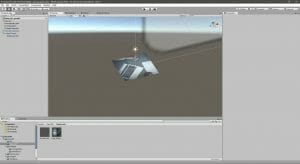
Now drag the Anchor_Material on the graph_anchor cube, this should be the result
Time to save the tutorial_graph scene!
Augmented Reality Histogram
In the last tutorial we generated our data visualization, now it’s time to edit that code in order to make the histogram spawn over our image target. This is really tricky because augmented reality doesn’t always detect perfectly our target, so don’t get frustrated if at the first try something goes wrong.
Let’s write a test function inside the “GenDataViz.cs” script in order to print a console message when the image target is detected
using System.Collections;
using System.Collections.Generic;
using UnityEngine;
using UnityEngine.UI; // Required when Using UI elements.
using TMPro; // required to use text mesh pro elements

public class GenDataViz : MonoBehaviour
{
    int scaleSize = 100;
    int scaleSizeFactor = 10;
    public GameObject graphContainer;
    int binDistance = 13;
    float offset = 0;

    //Add a label for the prediction year
    public TextMeshProUGUI textPredictionYear;

    //Check if image target is detected
    public GameObject Target;
    private bool detected = false;

    //The update function is executed every frame
    void Update()
    {
        if (Target.activeSelf == true && detected == false)
        {
            Debug.Log("Image Target Detected");
            detected = true;
        }
    }

   //continues with the rest of the code...
}
A little explanation of what the new code does:
- “public GameObject Target”, this object will be our ImageTarget prefab
- “private bool detected = false” will help us in order to identify the first detection
- The Update function, is a standard Unity function like Start(). The Update function is executed every frame. It’s a useful function when you have to check something continuously, but beware because it’s expensive on the CPU side. You can find more details about the Update function on the official Unity docs
- Inside the Update function, there an if that checks if the Target is active (so if the image is detected) and if is the first detection. We need to check if is the first detection in order to avoid expensive useless operations.
- Inside the if we have a simple console message and we assign detected true after the first detection
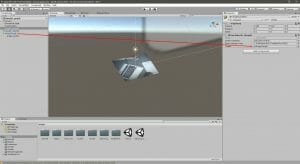
Select the GraphContainer from the Hierarchy section and drag the ImageTarget inside the Target section, as the screenshot shows below
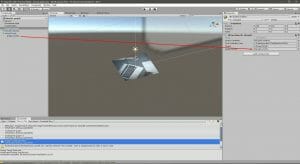
Now if you hit play and the camera detects the image target, the console should print this message “Image Target Detected”
Our patients’ number histogram should be created when the image target becomes active, so let’s edit the “GenDataViz.cs” script
using System.Collections;
using System.Collections.Generic;
using UnityEngine;
using UnityEngine.UI; // Required when Using UI elements.
using TMPro; // required to use text mesh pro elements

public class GenDataViz : MonoBehaviour
{
    int scaleSize = 100;
    int scaleSizeFactor = 10;
    public GameObject graphContainer;
    int binDistance = 13;
    float offset = 0;

    //Add a label for the prediction year
    public TextMeshProUGUI textPredictionYear;

    //Check if image target is detected
    public GameObject Target;
    private bool detected = false;

    //The update function is executed every frame
    void Update()
    {
        if (Target.activeSelf == true && detected == false)
        {
            Debug.Log("Image Target Detected");
            detected = true;
            // we moved this function from Start to Update
            CreateGraph();
        }
    }


    // Use this for initialization
    void Start()
    {
    }
//continues with the rest of the code...
}
As you can see:
- I moved the CreateGraph() function from Start() to Update(), this will allow us to check if the image is detected and then generate the graph
Now we need to position our 3D histogram on the Image Target, we will use our graph_anchor cube in order to retrieve the relative size, position and rotation. We edit again the “GenDataViz.cs” script, this is the full code of the script:
using System.Collections;
using System.Collections.Generic;
using UnityEngine;
using UnityEngine.UI; // Required when Using UI elements.
using TMPro; // required to use text mesh pro elements

public class GenDataViz : MonoBehaviour
{
    int scaleSize = 1000;
    int scaleSizeFactor = 100;
    float binDistance = 0.1f;
    float offset = 0;

    //Add a label for the prediction year
    public TextMeshProUGUI textPredictionYear;

    //Check if image target is detected
    public GameObject Target;
    private bool detected = false;
    // The anchor object of your graph
    public GameObject GraphAnchor;

    //The update function is executed every frame
    void Update()
    {
        if (Target.activeSelf == true && detected == false)
        {
            Debug.Log("Image Target Detected");
            detected = true;
            // we moved this function from Start to Update
            CreateGraph();
        }
    }


    // Use this for initialization
    void Start()
    {
    }


    public void ClearChilds(Transform parent)
    {
        offset = 0;
        foreach (Transform child in parent)
        {
            Destroy(child.gameObject);
        }
    }

    // Here we allow the use to increase and decrease the size of the data visualization
    public void DecreaseSize()
    {
        scaleSize += scaleSizeFactor;
        CreateGraph();
    }

    public void IncreaseSize()
    {
        scaleSize -= scaleSizeFactor;
        CreateGraph();
    }

    //Reset the size of the graph
    public void ResetSize()
    {
        scaleSize = 1000;
        CreateGraph();
    }


    public void CreateGraph()
    {
        Debug.Log("creating the graph");
        ClearChilds(GraphAnchor.transform);
        for (var i = 0; i < LinearRegression.quantityValues.Count; i++)
        {
            //Reduced the number of arguments of the function
            createBin((float)LinearRegression.quantityValues[i] / scaleSize, GraphAnchor);
            offset += binDistance;
        }
        Debug.Log("creating the graph: " + LinearRegression.PredictionOutput);

        // Let's add the predictio as the last bar, only if the user made a prediction
        if (LinearRegression.PredictionOutput != 0)
        {
            //Reduced the number of arguments of the function
            createBin((float)LinearRegression.PredictionOutput / scaleSize, GraphAnchor);
            offset += binDistance;
            textPredictionYear.text = "Prediction of " + LinearRegression.PredictionYear;
        }
        else
        {
            textPredictionYear.text = " ";

        }
    }

    //Reduced the number of arguments of the function
    void createBin(float Scale_y, GameObject _parent)
    {
        GameObject cube = GameObject.CreatePrimitive(PrimitiveType.Cube);
        cube.transform.SetParent(_parent.transform, true);

        //We use the localScale of the parent object in order to have a relative size
        Vector3 scale = new Vector3(GraphAnchor.transform.localScale.x / LinearRegression.quantityValues.Count, Scale_y, GraphAnchor.transform.localScale.x / 8);
        cube.transform.localScale = scale;

        //We use the position and rotation of the parent object in order to align our graph
        cube.transform.localPosition = new Vector3(offset - GraphAnchor.transform.localScale.x, (Scale_y / 2) - (GraphAnchor.transform.localScale.y / 2), 0);
        cube.transform.rotation = GraphAnchor.transform.rotation;

        // Let's add some colours
        cube.GetComponent<MeshRenderer>().material.color = Random.ColorHSV(0f, 1f, 1f, 1f, 0.5f, 1f);

    }

}
Many things changed in order to adapt our Histogram to the Augmented Reality target, let’s see what changed:
- I changed the initial values of scaleSize in order to have a smaller graph, feel free to change this value
- “public GameObject graphContainer” is removed and now “public GameObject GraphAnchor” takes its place
- binDistance” is now a float variable, this will allow us to be more accurate
- Creation of the “public GameObject GraphAnchor”, as you can expect this will be the reference to our graph_ancor cube
- The “createBin()” function now needs fewer arguments because the scale, rotation and position are retrieved from the parent object
- Inside “CreateGraph()” the function “createBin()” uses GraphAnchor instead of GraphContainer, the histogram is generated inside our graph_anchor cube
- I updated the lines “createBin((float)LinearRegression.PredictionOutput / scaleSize, GraphAnchor)“, now use a float instead of (int) in order to have a histogram that scales more accurately
- In the scale variable the expression “GraphPlatform.transform.localScale.x / LinearRegression.quantityValues.Count” helps us to bound the graph X dimension inside the parent object
Now select the GraphContainer object and drag the graph_anchor cube inside the Graph Anchor input field
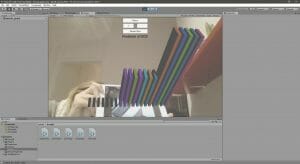
Open the menu scene, remember that the dataset is passed from the menu scene to the graph scene, so if you open directly the graph scene unexpected results can happen because the data will be missing. Insert a year of prediction and click on “Prediction”, the on “Data Visualization”. Now show your image target to the camera and graph with the patients’ numbers and the prediction should appear!
Fantastic job: you made it!
Conclusion
In summary, we created an application that can load a dataset derived from the numbers of patients which the hospital staff took care of during previous years, then make a prediction of how many patients they could expect to receive in future. During a meeting, this kind of application can be used in combination with image targets on paper documents, thus enhancing the interactivity of a report by making things easier to understand and visualize in people’s minds for funding and planning purposes.
A potential improvement to this project would be to connect the application to a live stream of data, then visualize that in Augmented Reality and in real time: in terms how the data changes over time >> Please feel free have a go at that or another customization according to your preference, and of course share your progress as well as any other thoughts in the comments below! Hope you enjoyed all the tutorials in this series, and we’ll see you next time – in the meantime take care :)

