You can access the full course here: Data Insights with Cluster Analysis
Table of contents
Part 1
In this video we are going to discuss Cluster Analysis. We will discuss the following topics:
- Intro to Cluster Analysis – what is it, what are it’s different applications, the kinds of algorithms we can expect.
- K-means clustering
- Density-based Spatial Clustering of Applications with Noise (DBSCAN)
- Hierarchical Agglomerative Clustering (HAC)
k-means, DBSCAN and HAC are 3 very popular clustering algorithms which all take very different approaches to creating clusters.
Before diving in, you can also explore why you might want to learn these topics or just what career opportunities these skills will present you with!
Cluster Analysis
Imagine we have some data. In cluster analysis, we want to (in an unsupervised manner – no apriori information), separate different groups based on the data.

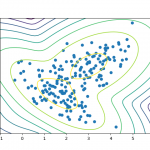
Looking at a plot of the above data, we can say that it fits into 2 different groups – a cluster of points in the bottom left and a larger, elongated cluster on the top right. When we give this data to a clustering algorithm, it will create a split. Algorithms like k-means need to be told how many clusters we want. In some cases, we don’t need to specify the number of clusters. DBSCAN for instance is smart enough to figure out how many clusters there are in the data.
The data above is from the IRIS data set. This was created by a famous statistician R.A. Fischer, who collected this data set of 3 different species of flowers and plotted their measured properties such as petal width, petal length, sepal width, sepal length. Since we are doing clustering, we have removed the class labels from the data set as that is what the clustering algorithms is trying to give us in terms of what data points belong together.
Clustering
Grouping data into clusters so that the data in each cluster has similar attributes or properties. For example the data in the small cluster in the above plot have small petal length and small petal width.
There are several applications of clustering analysis used across a variety of fields:
- Market analysis and segmentation
- Medical imaging – Xrays, MRIs, fMRIs
- Recommender systems – such as those used on Amazon.com
- Geospatial data – longitudinal coordinates etc
- Anomaly detection
People have used clustering algorithms to detect brain anomalies. We see below various brain images. C1 – C7 are various clusters. This is an example of clustering in the medical domain.

Another example is a spatial analysis of user-generated ratings of venues on yelp.com

Cluster Analysis
A set of points X1….Xn are taken in, analyzed and out comes a set of mappings from each point to a cluster (X1 -> C1, X2 -> C2 etc).

There are several such algorithms that will detect clusters. Some of these algorithms have additional parameters e.g. Number of clusters. These parameters vary for each algorithm.
The input however is a set of data points X1…Xn in any dimensionality i.e. 2D, 3D, 100D etc. For our purposes, we will stick with 2D points. It is hard to visualize data of higher dimensions though there are dimensionality reduction techniques that reduce say 100 dimensions to 2 so that they can be plotted.
The output is a cluster assignment where each point either belongs to a cluster or could be an outlier (noise).
Cluster analysis is a kind of unsupervised machine learning technique, as in general, we do not have any labels. There may be some techniques that use class labels to do clustering but this is generally not the case.
Summary
We discussed what clustering analysis is, various clustering algorithms, what are the inputs and outputs of these algorithms. We discussed various applications of clustering – not necessarily in the data science field.
Part 2
In this video, we will look at probably the most popular clustering algorithm i.e. k-means clustering.

This is a very popular, simple and easy-to-implement algorithm.
In this algorithm, we separate data into k disjoint clusters. These clusters are defines such that they minimize the within-cluster sum-of-squares. We’ll discuss this more when we look at k-means convergence. Disjoint here means that 1 point cannot belong to more than 1 cluster.
There is only 1 parameter for this algorithm i.e. k (the number of clusters). We need to have an idea of k before we run the algorithm. Sometimes it is obvious how many clusters we should have, but sometimes it is not that clear. We will discuss later how to make this choice.
This algorithm is a baseline algorithm in clustering.
The cluster center/centroid is a point that represents the cluster. The figure above has a red and a blue cluster. X is the centroid – the average of the x and y coordinates. In the blue cluster the average of the x and y coordinates is somewhere in the middle represented by the X in the middle of the square.
K-means Clustering Algorithm
1. Randomly initialize the cluster centers. For example, in the above diagram, we pick 2 random points to initialize the clusters.
2. Assign each point to it’s nearest cluster using distance formula like Euclidian distance.
3. Update the cluster centroids using the mean of the points assigned to it.
4. Go back to 2 until convergence (the cluster centroids stop moving or they move small imperceptible amounts).
Let’s go through an example (fake data) and discuss some interesting things about this algorithm.

Visually, we can see that there are 2 clusters present.
Let’s randomly assign the cluster centers.

Let’s now assign each point to the closest cluster.

The points are now colored blue or red depending on which centroid they are closer to.
Next we need to update our cluster centroids. For the blue centroid, we take the average of all the x-coordinates – this will be the new x-coordinate for the centroid. Similarly we look at all the y-coordinates for the blue points, take their average and this becomes the new y-coordinate for the centroid. Likewise for the red points.
When I do this, the centroids shift over.

Once again I need to figure out which centroid each point is close to, which gives me the following.

Once again, I update my cluster centroids as before.

If we try to do another shift, the centroids won’t move again. This is evident from the last 2 figures where the same points are assigned to the cluster centroids.
At this point, we say that k-means has converged.
Convergence
Convergence mean that the cluster centroid don’t move at all or move a very very small amount. We use a threshold value to indicate that if the centroid does not move at least that much the k-means has converged.

Mathematically, k-means is guaranteed to converge in a finite number of iterations (assigning point to a cluster and shifting). It may take a long time, but will eventually converge. It does not say anything about best or optimal clustering, just that it will converge.
K-means is sensitive to where you initialize the centroids. There are a few techniques to do this:
- Assign each cluster center to a random data point.
- Choose k points to be farthest away from each other within the bounds of the data.
- Repeat k-means over and over again and pick the average of the clusters.
- Another advanced approach called k-means ++ does things like ANOVA (Analysis Of Variance). We won’t be getting into it though.
Choosing k (How many clusters to use)
One way is to plot the data points and try different values to see what works the best. Another technique is called the elbow method.
Elbow method

Steps:
- Choose some values of k and run the clustering algorithm
- For each cluster, compute the within-cluster sum-of-squares between the centroid and each data point.
- Sum up for all clusters, plot on a graph
- Repeat for different values of k, keep plotting on the graph.
- Then pick the elbow of the graph.
This is a popular method supported by several libraries.
Advantages Of k-means
- This is widely known and used algorithm.
- It’s also fairly simple to understand and easy to implement.
- It is also guaranteed to converge.
Disadvantages of k-means
- It is algorithmically slow i.e. can take a long time to converge.
- It may also not converge to the local minima i.e. the optimal solution.
- It’s also not very robust against varying cluster shapes e.g. It may not perform very well for elongated cluster shapes. This is because we use the same parameters for each cluster.
This was a quick overview of k-means clustering. Lets now look at how it performs on different kinds of data sets.
Did you come across any errors in this tutorial? Please let us know by completing this form and we’ll look into it!

FINAL DAYS: Unlock coding courses in Unity, Godot, Unreal, Python and more.
Transcript 1
Hello, world, and thanks for joining me. My name is Mohit Deshpande. In this course, we’ll be learning about clustering analysis. In particular, we’re gonna use it in the context of data science, and we’re gonna analyze some data and see if we can segment out different kinds of customers so that we can provide them with all kinds of neat promotional discounts or special offers.
This is a very common thing that’s done for a lot of companies. We have a bunch of data. We wanna figure out unique groups of customers so that we can offer them special things.
In this course, we’ll be learning a little bit about three different kinds of clustering algorithms. First, I wanna introduce you to the concept of clustering, or what is clustering, and what are some other applications of it. Then we’ll get onto three different clustering algorithms, and what’s really neat is that they all approach clustering in a very different fashion.
So first, we’re gonna learn about a very popular kind of clustering called K-means clustering. Then we’ll look into a density-based clustering algorithm called DBSCAN. Then finally we’ll discuss a hierarchical clustering algorithm called hierarchical agglomerative clustering. And then we’ll see different kinds of data, where they work really well, and where they don’t work quite so well. So we’ll get a good idea of, at least some kind of notion, of which kind of clustering algorithms tend to work well on which kind of data.
Then, finally, we’re gonna tie everything together by looking at a real world data set and see if we can segment out different customers. We’ve been making courses since 2012, and we’re super-excited to have you on board. Online courses are a great way to learn new skills, and I take a lot of online courses myself.
Several courses consist mainly of video lessons that you can watch at your own pace and as many times as you want. So feel free to watch and re-watch and pause the video as many times as you want. We also have downloadable source code and project files and you’re getting everything that we build during the lesson.
It’s highly recommended that you code along with me. In my experience, that’s the best way to learn something is to get your feet wet. Lastly, we’ve seen the students who get the most out of these online courses are those who make a weekly plan and stick with it, depending, of course, on your own availability and learning style. Zenva, over the past six years, has taught all kinds of different topics on programming and game development, over 300,000 students, across 100 courses. The skills that they learned in these courses are completely transferrable. In fact, some of the students have used the skills that they’ve learned to advance their careers, to make a start-up, or to publish their own content from the skills that they’ve learned.
Thanks for joining, and I look forward to seeing the cool stuff you’ll be building. Now, without further ado, let’s get started.
Transcript 2
In this video, we are going to learn a little bit about cluster analysis. And this is a topic that we’re gonna be discussing over the duration of this course.
So just to give you an overview of the different things we’re gonna be covering, I’m gonna give you an introduction to cluster analysis, basically what is it and what are the different applications of it, as well as what kind of algorithms can we expect. And in fact, we’re gonna be covering three very popular algorithms, k-means clustering, DBSCAN, which stands for density-based spatial clustering of applications with noise, but usually we just call it DBSCAN, and then hierarchical agglomerative clustering, HAC.
These are three very popular clustering algorithms. And the interesting thing is they all take very different approaches to creating clusters. And we’re gonna get into all those in the subsequent videos. But first let’s talk a little bit about cluster analysis. And that’s what we’re gonna be focusing on primarily in this video, just to acquaint you with some of the terminology as well as some applications of cluster analysis for example. So clustering analysis, so imagine we have some data.
The whole point of clustering analysis is in an unsupervised way with no prior information, we want to be able to separate different groups based on the data that we have. And now sometimes these groups are predefined. You have the set of data like in this case, and you say, well, this seems, we plot this data, and you say, well, it seems to fit into two little groups. Here there’s a little clustering of points on the bottom left, and there’s a larger, kind of elongated cluster on the top right and so we might say, well, we can give a predefined number of clusters.
We want two clusters and we can give that to the clustering algorithms and then they’ll group these guys together. It’ll make a split and it actually, in some cases, we don’t need to specify the number of clusters. In fact, some algorithms, which is DBSCAN, are actually smart enough to be able to figure out how many clusters are based entirely on the data. But algorithms like k-means will actually need to be specified how many clusters that we have.
And so, for example, this data scan is actually taken, it’s a very famous data set called the Iris Dataset, collected by Ronald Fisher, which is, and here is a quick historical side note, he’s probably the most important statistician of the 20th century. A lot of statistical techniques that we have that are used in all kinds of companies were originally some of his work, but he collected this dataset of flowers. He has 50 different of three different kinds of species of flowers and he plots their measured properties like petal width, petal length, sepal width, and sepal length, and they’re all plotted out.
In this case, what I’ve actually done is removed the class labels, because usually when we’re doing clustering analysis, we don’t have the correct labels. In fact, that’s what the clustering is trying to give us. It’s trying to give us some notion that these things belong together and these other things belong together. So this is just a kind of data that you might expect with some clustering.
So clustering is taking our data and then putting it into groups such that the groups have some kind of similar properties or similar attributes here. So if we go back a slide here, so we have one cluster at the bottom left for example. That might be considered a cluster where the flowers in that cluster have a small petal length and a smaller petal width, for example. That’s an example of grouping, as I’m talking about.
And there’s so many different applications of clustering analysis, not just used for something like data science. But also things like medical imaging for things like x-rays or MRIs or FMRIs. They use clustering analysis. Recommender systems like those used on websites like Amazon.com and whatnot, they recommend you can use clustering analysis to help build recommendation systems. Geospatial data, of course, our data is in latitude and longitude coordinates and we can do some kind of clustering with that as well. And we can also use it for things like anomaly detection in our data. The top bullet point here is that we can use it for market analysis and segmentation, a very popular technique for that as well.
And so this kind of gives you a little bit of the applications of clustering analysis and certainly the algorithms that we’re gonna be learning are used in the field and can be used for your data as well. So for example, people have used clustering algorithms to actually do things like, to check brain anomalies, so here are just images I’ve taken of the brain and the different C-1 to C-Center are different clusters of the brain. They use a different clustering metric. And the result is, you can kind of segment out different kinds of brain anomalies. So it’s an application of clustering in the medical domain.
And another domain, what these guys have done is look at reviews on Yelp.com, and they’ve performed a spatial analysis of that. So there are a lot of different applications of clustering in many different fields.
So just a quick overview of clustering, but we can get a little bit more formal with this, with the algorithms. So you can think of clustering analysis on the bottom here, as just taking in a set of points, X1 to Xn. And then we churn it through a machine that is the cluster analysis, and then out comes an assignment that maps each point to a particular cluster. So on the bottom here, X1 is mapped to Cluster 1, X2 is mapped to Cluster 2, and there are a lot of different algorithms that exist to detect clusters.
In fact, like I’ve mentioned, we’re gonna be covering three of them, of the most popular ones. Now the parameters, some of these algorithms have additional parameters to them. So like I mentioned before, one of those parameters might be the number of clusters that you have that might have to be something that’s pre-defined that you would give to an algorithm. But there are sometimes other parameters as well, and they vary for each algorithm, so there’s no uniformness among the parameters. However, like you see in the chart here, the input to clustering algorithms is usually a set of data points, X1 to Xn, and they can be of any dimensionality, they can be in 2D, they can be 2D points, they can be 3D points, they can be 100 dimensional points.
But for our purposes, we’re just gonna stick with 2D points. It is certainly possible to do clustering on higher dimensionality data, but one of the issues is actually visualizing that higher dimensional data. Because we can’t really plot a hundred dimensional graph terribly easily, but there exist dimensionality production techniques that can press 100 dimensions down into two so we can plot it, but that’s a little beyond the scope of the course here. So we’re mostly gonna be sticking with 2D.
And then the output, like I said, is a cluster assignment. So each data point belongs to a cluster, or actually in some cases, some algorithms have some notion of outliers or noise built in, so just DBSCAN for example. So a point may not necessarily belong to an exact cluster, it might also belong to, it might be a noise point or some people like to think of it as being a noise cluster, although that’s not quite correct. But that is the output, and this is kind of a generalization of clustering algorithms. They take in this set of input points and then they produce a mapping that maps each point to a cluster or perhaps to a noise point.
And you can think of clustering analysis as being a kind of unsupervised machine learning, per se. And it’s unsupervised because generally, with clustering analysis, we don’t have any labels for our data. We just get a set of points and we’re set to cluster them. And so this unsupervised, and there are techniques that might use class labels to help do some kind of clustering or provide some other auxiliary information, but in many, many cases, clustering analysis is done unsupervised. We don’t have correct labels.
Alright, so that is just a quick overview of clustering analysis, so basically, what is clustering analysis, what kind of inputs we give to a clustering algorithm, what kinds of outputs do we expect from a clustering algorithm, and also discuss a little bit about different applications of clustering algorithms used in a wide variety of fields. It doesn’t even have to be something like data science or computer science, it can be used in the medical field, in business, finance, and so learning this information, we can take this and apply it to many other fields. So that is just a quick introduction to clustering analysis.
Transcript 3
In this video we are going to look at probably the most popular clustering algorithm called K-means clustering. So K-means clustering, the point of it is to take our cluster data and then separate it into K disjoint clusters, and these clusters are defined so that they minimize what’s called the within-cluster sum-of-squares, but we’ll get to that a bit later. You’ll see what that means when we discuss a little bit more about K-means convergence.
So the point of K-means clustering is to separate the data into K disjoint clusters. What I mean by disjoint clusters means that one point cannot belong to more than one cluster, and the only parameter that we have to set for this algorithm is the number of clusters. So you’ll see an example of an algorithm where you need to have some notion of how many clusters you want your data to have before you run the algorithm. Later, we’re gonna discuss how you can select this value of K, because sometimes it’s quite obvious how many clusters you have, but many times it’s not quite so clear how many clusters you should have, and so we’ll discuss a couple techniques a bit later on how to choose this parameter K.
So K-means clustering is very popular, very well-known. It actually, the algorithm itself is quite simple. It’s just a couple lines of algorithm code and the code itself is writing, if you had to write it from scratch also, it’s not something that would take you a long time. It’s very popular. I mean, it’s taught in computer science curriculums very commonly. So knowing this algorithm is kind of the first step to getting more acquainted with clustering. It’s kind of the baseline algorithm, and we’ll move on to more complicated algorithms a bit later, and then one point of terminology here.
You’ll often hear something called a cluster center or a centroid, and really that’s just a point that represents a cluster, so in the figure that I have here on the bottom right, we have two clusters. We have a red cluster and a blue cluster, and the X is the centroid. In other words, the centroid is really like the average of the X coordinates and the average of the Y coordinates and then that’s the point. So you can see in the blue, the average, if I average the X coordinates is somewhere gonna be in the middle, and if I average the Y coordinates, that’s gonna be somewhere in the middle and we end up with some centroid that’s in the middle of that square, and so that’s what I mean by centroid. So that’s all we really need to know about K-means.
Now we can get to the algorithm, we can actually get to the algorithm. I’m going to go through an example with you so you can kinda see it progress step-by-step with just some fake data, and then we’ll discuss some more interesting things about it such as convergence, properties, you know, talk a little bit about what convergence is, and then we’ll also discuss a bit later how do you select the value of K and what not. So but we’re gonna get to that.
So the clustering algorithm, the first step to the clustering is you randomly initialize the cluster centers. So suppose I have some data, that I have two clusters of four like in the previous chart. I have two clusters, so what I do is I just pick two random points to initialize the clusters. Now, the algorithm doesn’t, there are many ways to do this, and we’ll discuss a couple different ways a bit later, and so after you pick, we randomly initialize our cluster centers, then for each point we assign it to its nearest cluster using some kind of like metric, like the distance formula for example, Euclidean distance, and then we update the cluster centroids by taking the mean of the points assigned to it.
So after each point is assigned to a centroid, we look at the centroids and see how many points are assigned to this one centroid, and then we just average all the points, and that’s gonna shift the centroid. We basically keep doing this.
After the centroids have shifted, we then reset all of our points and figure out where the near, who, assign them to the nearest cluster again, and we just keep doing this until the cluster centroids stop moving or they move a very, very small imperceptible amount. Now, let’s actually do an example of this with some data so you have a better understanding of what I mean by each of these steps. So here is our data and we wanna cluster it and we want it to, we’re setting K equals two. There’s two clusters, okay?
If we look at this data we can kinda see that, well, yeah, there are two clusters here. So here is just like randomly initialized the two clusters. There’s red and blue, and just placed ’em somewhere on the plane. So now what I want to do is for each point, I’m going to assign it to the closest cluster. So after I do that I get something like this. So now I have colored all the points red or blue depending on if it’s closer to the red centroid or closer to the blue centroid.
So after I’ve done this, now I need to update my cluster centroid. So how I do that is I look at all the X, for example, for the blue centroid, I’ll look at all the X coordinates and take the average and that’s my new X coordinate for the centroid. I look at all the Y coordinates of all the blue points and I take the average of those and that becomes the new Y coordinate for my blue centroid. So after I do this, the centroids kinda shift over and then I reset the colors of all the points, and now I just do the same thing again.
So now for each point I have to figure out which centroid is it close to. So after I do that I get this assignment, and now I, again, take the average of the X coordinates and the average of the Y coordinates for each cluster and that becomes the location of my new centroid, and I shift it over again, and so now it’s gonna be here, and now let’s do another, now I do this one more time, and you’ll see that now, where if I try to do another shift, that nothing will, the cluster centroids won’t actually move again because in the previous step we see that the same points are assigned to the same cluster centroids.
So in other words, my centroids aren’t gonna move, and at this point we say that K-means has converged. So I hope that this gives you a bit of an overview of a K-means here as in how do you actually run the algorithm in step. So like I mentioned convergence, just ignore that big equation. It looks kinda scary but this is just to illustrate a point here. So convergence means that the cluster centroids either don’t move entirely or they move a very, very small very small amount, and you usually just set a threshold value. So if they don’t move at least this much, then we say they’ve converged.
The reason that I put this equation up here is just to illustrate the point that mathematically K-means is guaranteed to converge in a finite number of iterations, and by iterations I mean assigning the points to a cluster and then shifting and then assigning the points to a cluster and shifting.
In a finite amount of iterations, it is mathematically guaranteed to converge. Now, finite number, that still means that it might take a long time, but it will eventually converge. Now, this convergence, that theorem of K-means, doesn’t say anything about converging to the best cluster or converging to the optimal clustering. It just says that it will converge. This is still a useful property to know about K-means because this might not be true of other algorithms.
So one other point that I want to discuss is that K-means is actually quite sensitive to where you initialize the centroids, and there are a couple techniques to do this. So one technique that people like to use is you can just assign a cluster to be a random data point. So you pick a data point and say that is my cluster center. Another interesting thing is to choose K points that are the farthest away from each other. So if I have two points, I’ll choose two points that are the farthest away from each other within the bounds of my data, between the bound of the smallest X coordinate and the largest X coordinate, smallest Y coordinate, largest Y coordinate, and another approach is to repeat my K-means many times over and over again.
You just run the algorithm over and over again using one of these initializations and just take the average of the clusters. There’s another way more advanced approach called K-means plus plus that does all kinds of analysis of variance, but we’re not gonna get into that. In fact, we don’t have to implement it either ’cause it’s usually embedded in many libraries. Okay, so the only thing that remains to talk about is how do you choose a value of K. Well, one other thing to do is just plot your data, try a couple K values, and see which clustering works the best.
Another technique that’s actually quite popular is called the elbow method, and what you do is you choose some values of K, you run the clustering algorithm, you compute this thing called a within-cluster-sum-of-squares. In other words, you take the centroid and each data point assigned to that centroid and compute the sum of the square differences between those guys and you sum up all that. So for each cluster so you get one of those, and then you sum it up for all the clusters and you plot that on a graph, and you can keep plotting this on a graph for different values of K and then you pick the elbow of this graph here and that’s, it’s not a very clear-cut way as to what value of K you should use, it just gives you kind of an idea of what the range of different K you should choose there.
So this is also very popular and, again, there are lots of libraries that can actually generate this for you. You can do this yourself as well. So this is just a technique that you might wanna use to figure out how many values of K you should use. Okay, so that pretty much covers K-means clustering.
So I wanna talk a little bit about some of the advantages and disadvantages of this, and then later we’re gonna actually see it run on different kinds of data, and we’ll see how well it performs there. So it’s widely known and used, very popular like I said. It’s a fairly simple algorithm actually. It’s really only like four steps, and in lines of code wise it’s not that long either. It’s in the algorithm, easy to implement. One big perk is that it’s guaranteed to converge. It’s pretty nice.
Disadvantages of K-means, it’s algorithmically pretty slow if you know anything about big O notation. It’s take a long time for it to converge. Another issue is that it might not converge to the best solution. It’s guaranteed to converge, but it might not converge to the best solution, and it’s not very robust against clusters that have various shapes, like elongated clusters for example. It might not perform so well.
We’re actually gonna see this when we look at some fake data. We’ll see how well it performs against elongated data for example. And the reason for this is because we’re using the same parameters for each cluster when we do this. So anyway, that is just a quick overview of K-means clustering, and so now that we have this example we can go ahead and try to look at, analyze how it performs on different kinds of data sets.
Interested in continuing? Check out the full Data Insights with Cluster Analysis course, which is part of our Data Science Mini-Degree.